1.2.7
Construct suitable representations to illustrate system requirements.
Teaching Note:
Examples include: system flow charts, data flow diagrams, structure chart.
UML is not required.
LINK Flow chart symbols, flow charts and pseudocode.
Sample Question:
sdfsdfsf
JSR Notes:
Firstly, recognize that the system flowchart is arguably the most important for this Topic 1.2, since it deals with system design, but the other two are mentioned as well in the Teaching Note, and certainly class diagrams are useful to us, particularly in the IA solution process.
Diagrams of various types help teams visualize how a system will look and/or operate, and how data will flow through it. Various kinds of diagrams can be used for both software design, and full IT system design.
Flow Charts
Flow charts are a type of easy-to-understand diagram that represents an algorithm, work-flow or process, showing the steps as boxes of various kinds, and their order by connecting them with arrows. Flowcharts are used in analyzing, designing, documenting or managing a process or program in various fields.
(IT) System Flow Charts
System flow charts diagrams that show how the basic steps in how the process of a proposed IT system fit together. IT teams use them in planning to show how processes are intended to work, and for figuring out how to put the system together.
System flow charts used in IT systems planning help:
- inform various decisions that will have to be made, and the steps that will need to be taken.
- estimate development time-frames, and identify who should be involved at each step
- identify bottlenecks or other potential problems
- clarify understanding of the problem, and so help improve it even before the start of implementation
- and generally communicate the plan to all involved.
Creating a System Flow Chart
To create a flow chart, identify the tasks and decisions that you make during a process, and write them down in order. Then, arrange these steps in the flow-chart format, using the appropriate shapes for actions to take and decisions to make. Complete with "Start" and "Finish" symbols to show the beginning and end of the process.
Finally, test your flow chart to make sure that it accurately represents the process, and that it shows the most efficient way of doing the job.
Example Flow Chart 1
Do note that this is a *system* flowchart, not a programming flow chart as you may do (or may have done) as part of your IA. Programming flow charts are similar, but less directed toward hardware, and more directed toward step-by-step coding instructions.
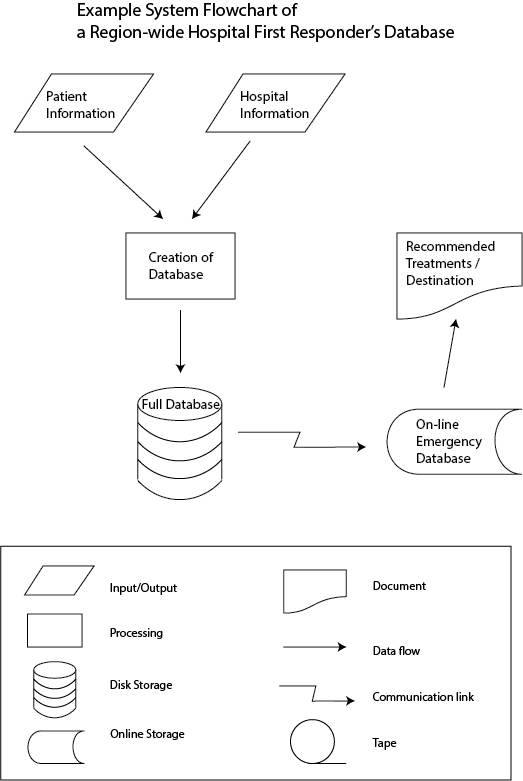
Other symbols you may use include:
- the classic "diamond" decision symbol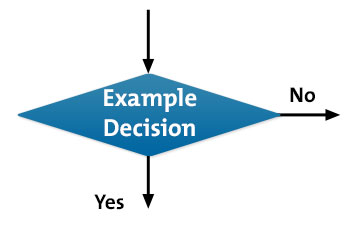
- the rounded Start and Finish symbols ![]()
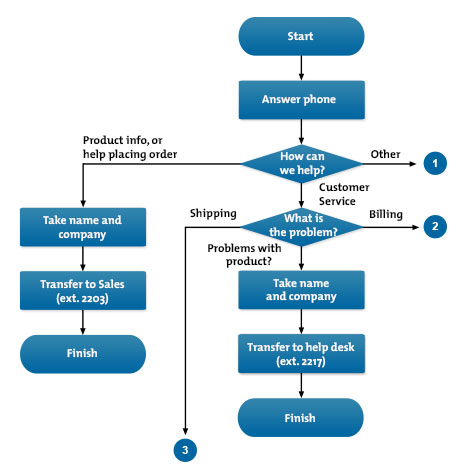
Flow Chart Example 2
For Showing how to Route Incoming Phone Calls
Data Flow Diagrams
Data flow diagram is graphical representation of flow of data in an information system; so it does not include the hardware parts, or indeed the software parts - only the data itself as it flows through a system. It is therefore capable of depicting incoming data flow, outgoing data flow and stored data.
The following are the main symbols used:
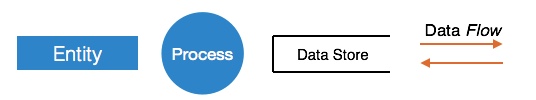
- Entities - Entities are source and destination of information data.
- Process - Activities and action taken on the data.
- Data Storage - When, but not how, data is stored.
- Data Flow - Indicating the direction of data flow.
Example Data Flow Diagrams
We can look at data flow at various levels of abstraction through the company or organization
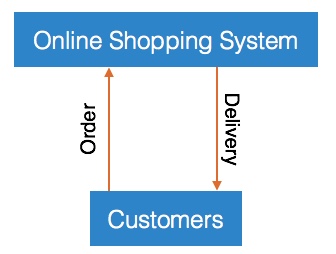
Highest Level of Abstraction Example
One Level of Abstraction Lower Example
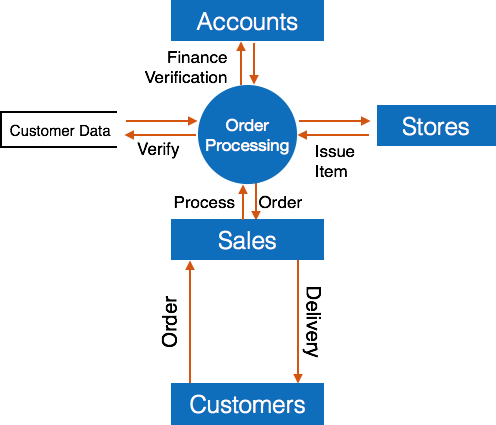
And you could go even further, and look at each particular area, and the data flow within it.
Structure Chart
It is possible that the structure charts the assessment statement refers to are ones derived from Data Flow Diagrams. In this is the case, these would be diagrams which represents the system in even more detail than Data Flow Diagrams, breaking the system down into its lowest functional modules, describing functions and sub-functions of each module of the system in detail, often in a hierarchical way.
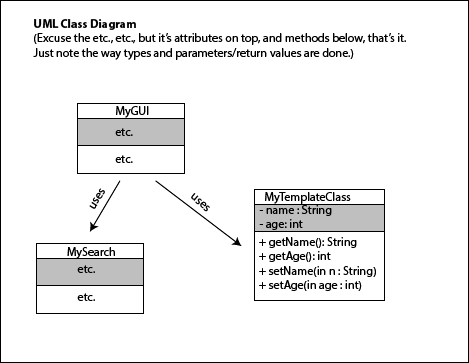
But the Teaching Note says it's not necessary to use UML, so we should take it that diagrams more detailed than Data Flow Diagrams above are not needed. Never-the-less, we do use another kind of "structure chart", and indeed a UML version of it in our IA solution process. With UML class diagrams, we demonstrate the way that classes are arranged. Below is an example. And note that we do look at UML for class diagrams in more detail during our IA solution process.
IA Solution Connection and Considerations
Other Chart Examples for your IA Solution, you could use include:
Pseudocode / Algorithm Flowchart - with this, you can use typical flowchart symbols to demonstrate how a particularly complex method you are devising will work.
Final notes:
Note that we used another kind of diagram here when learning programming control structure: the flow of control diagram.
And other examples of system flow charts are on pages 21 - 23 of the old IB CS curriculum Yellow & Red textbook.